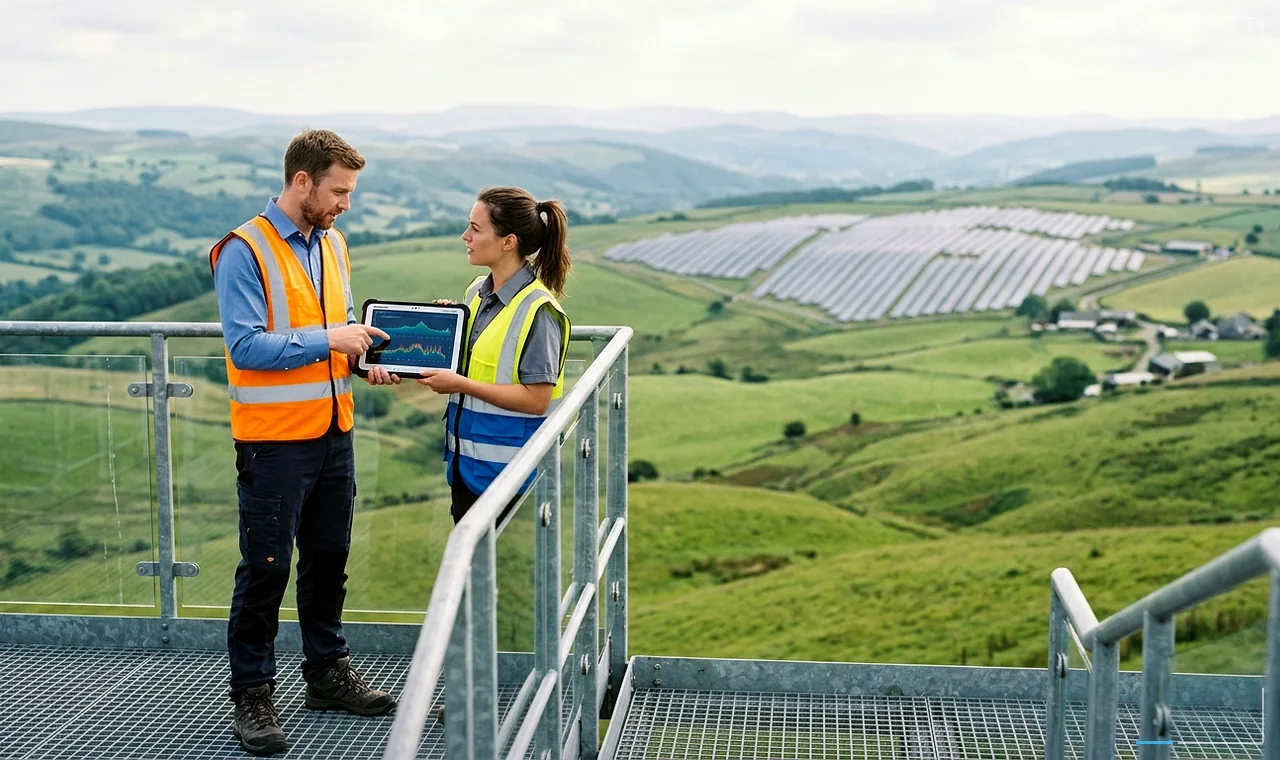
Although a regional electric utility had installed 1.2 million smart meters, their telemetry sat trapped in siloed vendor databases that updated BI reports only once a day. During summer storms, dispatchers still relied on customer phone calls to guess which neighborhood transformer blew. SNWN built a streaming cloud data lakehouse with Kafka, dbt, and geospatial BI dashboards that correlate meter 'last-gasp' pings in under 30 seconds - cutting crew localization time by 52%.
Millions of Smart-Meter Data Points Sitting Unused During Storms
Smart meters send a brief 'last-gasp' radio ping milliseconds before losing power, along with 15-minute voltage readings that warn when rooftop solar backfeed is overheating a neighborhood transformer. Yet legacy SQL servers choked on 115 million daily meter readings, leaving field engineers blind during severe weather.
Key Operational Bottlenecks Before the Project
- Dispatchers waited on inbound customer call clusters to narrow down broken feeder lines, wasting 45+ minutes per truck roll.
- Regulatory reliability reports (SAIDI / SAIFI) took three analysts a full week of manual Excel merging every month.
- Overloaded suburban transformers failed unexpectedly during heatwaves despite warning voltage spikes days earlier.
How We Turned Raw Meter Pings Into Live Field Dispatch Maps
We separated high-speed storm alerting from historical BI analytics so dispatchers get sub-30-second map pins while engineers query years of voltage trends effortlessly.
Streamed Head-End Smart Meter and SCADA Feeds Into Cloud Event Hubs
We built fault-tolerant MQTT and Kafka ingestion connectors that handle 115M+ daily meter readings and storm-surge bursts without dropping packets or straining operational SCADA networks.
Modeled Bronze-Silver-Gold Lakehouse Tables with dbt and Apache Iceberg
Raw meter telemetry joins cleanly with GIS pole coordinates, feeder topology trees, and weather radar data inside governed Iceberg tables - turning cryptic meter IDs into exact street intersections.

Launched Live Geospatial Outage Pinpointing for Control-Room & Crew Tablets
When five or more meters on a shared lateral lose power simultaneously, graph rules trace the exact upstream fuse or transformer in 20 seconds and push GPS routing straight to the nearest line-truck tablet.
Automated Transformer Thermal Risk Scoring and One-Click Regulatory BI
Nightly anomaly models flag transformers experiencing sustained heatwave overload so crews swap units before they blow, while Power BI dashboards calculate audited SAIDI/SAIFI metrics automatically.
Faster Lights-Back-On for Households and Safer Preventive Maintenance
During two autumn windstorms after launch, line crews arrived at exact fault poles before many residents even picked up the phone to report an outage.
Faster Fault Localization
Cut time-to-pinpoint broken lateral fuses and transformers from 48 minutes to 23 minutes.
Daily Meter Readings Processed
Ingested, enriched, and queryable at sub-second speed with zero pipeline backlogs.
Drop in Unplanned Transformer Blowouts
Early voltage-heat alerts let crews swap overloaded units during scheduled daytime windows.
Day-to-Day Business Impact
- System Average Interruption Duration Index (SAIDI) improved by 19% year-over-year.
- Monthly regulatory compliance packs generate in 10 minutes instead of 5 analyst-days.
- Strict read-only unidirectional gateways kept operational OT networks 100% isolated from cloud BI users.
Tools, Platforms, and Technologies Used
Every component in this deployment was selected for long-term stability, clear observability, and straightforward handover so internal engineers never get locked into black-box scripts.
Data Analytics, Lakehouse & BI
See how our specialists design, migrate, and manage workloads like this every day.
Frequently Asked Questions About This Project
How do you connect smart-grid OT systems to cloud analytics without cyber risk?
Telemetry flows strictly one way out of the SCADA/AMI head-end zone through DMZ data diodes and mTLS brokers. Cloud analytics systems have zero inbound network path back into grid switching controls.
How does smart-meter telemetry pinpoint the exact broken pole or fuse?
By mapping every meter to its parent transformer and feeder tree in PostGIS, simultaneous 'last-gasp' power-loss signals instantly reveal the lowest common upstream device that tripped.
Can field linemen view these maps in areas with spotty rural cell coverage?
Yes. Crew tablets cache regional feeder topology maps offline and sync tiny lightweight fault-pin JSON packets over low-bandwidth LTE.